SaaS

Toast (NYSE: TOST) Long Recommendation*

* The content is for informational purposes only, you should not construe any such information or other material as legal, tax, investment, financial, or other advice.

By Otakar Korinek, Jeffrey Zhang, Kevin Zhang

Company Overview 

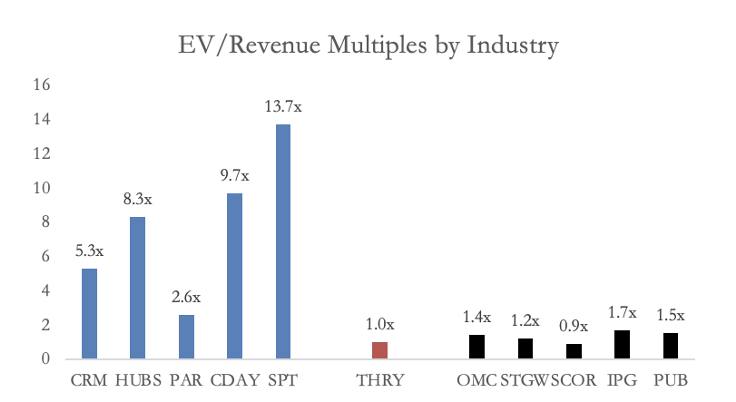
Toast is a cloud-based, all-in-one digital tech platform for the entire restaurant industry. The  platform offers services such as reporting and analytics on real-time sales, menu, and labor  data, as well as Toast Partner Connect and APIs to customize the tech stack from a portfolio of  160 partners. Additionally, the company offers subscription services such as order and pay from  mobile/OTC, card reader, kitchen display, multi-location management, online ordering/takeout  services, and marketing insights.  

Figure 1 - Toast Product Offering

Toast has four primary revenue vertices: subscription services (32.6% of gross profit, 29% of  revenue), fintech solutions (83.6% of gross profit, 49% of revenue), hardware (-11.4% of gross  profit, 19% of revenue), and professional services (-7.9% of gross profit, 3% of revenue). Key  drivers of ARR include locations and ARPU. 

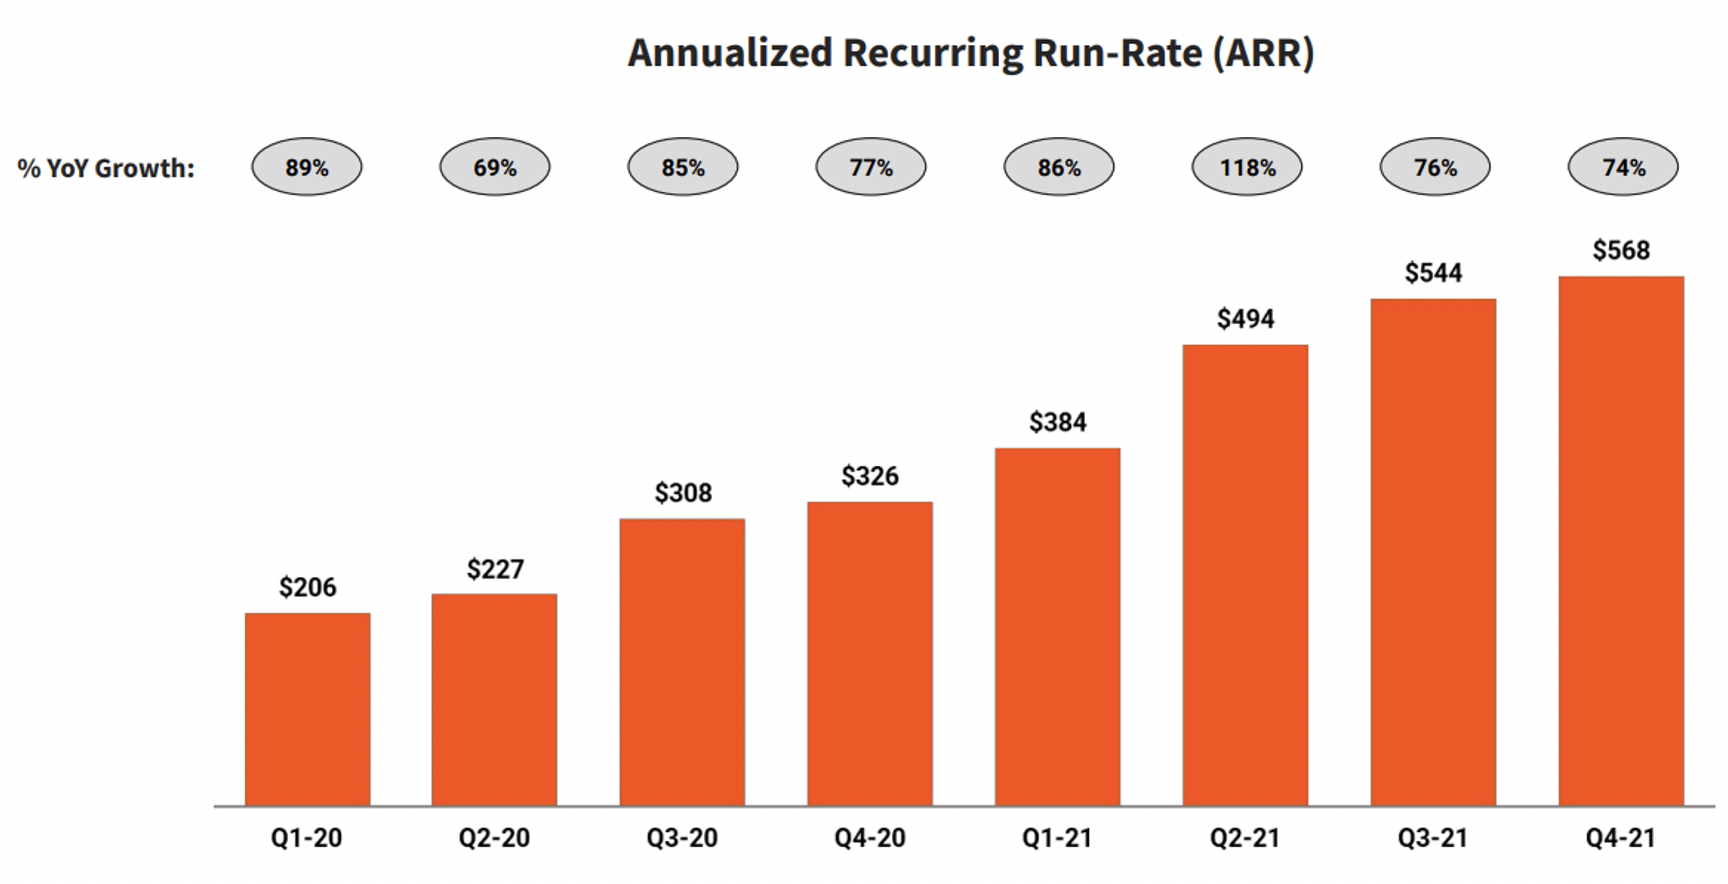
Figure 2 - Toast ARR Growth 

Industry Overview 

The foodservice and restaurant industry is valued at around $860 billion in GPV in 2021, and  Toast's global TAM is estimated at around $50 billion, which is at least twice as large as the  domestic TAM. The US TAM for the restaurant industry's annual spending on technology is  around $25 billion, or 2.7% of sales, while the SAM for Toast is estimated at around $15 billion.  This implies around $17.5k in revenue per restaurant location. 

The US restaurant POS market is highly fragmented, with only 24% of locations using cloud based POS systems. However, with POS systems having a typical lifespan of around 6 to 8 years  and a recent upgrade cycle in 2015, there is an increased incentive for restaurant owners to  switch to cloud-based solutions post-2022. Toast has a distinct advantage in this market, thanks  to its low upfront costs for hardware and professional services, as well as its flexibility and  functionality. The Capterra POS survey shows that ease of use (28%), functionality (27%), and  price (20%) are the main considerations for POS purchases. Additionally, Toast has market leading win rates, driven by its less painful switching process with discounted hardware and  services, compared to its competitors. 

Figure 3 - Market Share in Restaurant PoS

Our 2 Core Theses 

  1. Undervalued growth opportunities both structurally in restaurant industry and  idiosyncratically through Toast’s go-to-market strategy 

    1. Underestimated terminal recurring TAM 

    2. Superior product and focus on restaurants helps Toast win head-to-head for  customers 

  2. Payroll addon leading to higher ARR opportunities, and missed opportunities in switch  towards CNP payments leading to underestimate take rates 

    1. StratEx acquisition highly accretive to ARR 

    2. Toast has substantial room for take rates increases 

1.1 Toast’s terminal recurring TAM is grossly underestimated 

The restaurant industry spends just 3% of revenue on IT, compared to 5% economy-wide,  creating a huge annual market opportunity for Toast.  

Figure 4 - The Restaurant industry is under-spending on IT 

Roughly 60k restaurants open per year due to both fresh openings and churn within the  industry. This allows for 60k new restaurants per year in POS demand. The average lifespan of a  POS system is 7-8 years, creating so 10-15% of restaurants per year forced to replace systems.  Due to the high natural churn rate, it creates consistently high annual TAM. In actuality, 60k +  12.5% x 600k = 135k restaurants per year open to POS replacement.  

Toast services 74k restaurants (42% YoY growth), but this is only 10% penetration of the TAM of  ~860k restaurants in the US. The SAM of ~600k restaurants (excluding chains) is the primary  target for Toast, which is small-sized restaurants. Restaurant subscriptions ARR is ~$3K. Given  3% spending on IT, it implies ~$100k annual sales in restaurants. Roughly 1.6 Toast locations  per customer, implying that Toast is serving the lower end of the restaurant spectrum. This 

results in faster acquisition (only must convince the owner), higher stickiness, and higher  margin payment processing (0.8-1.2% net yields vs 0.01-0.1%). 

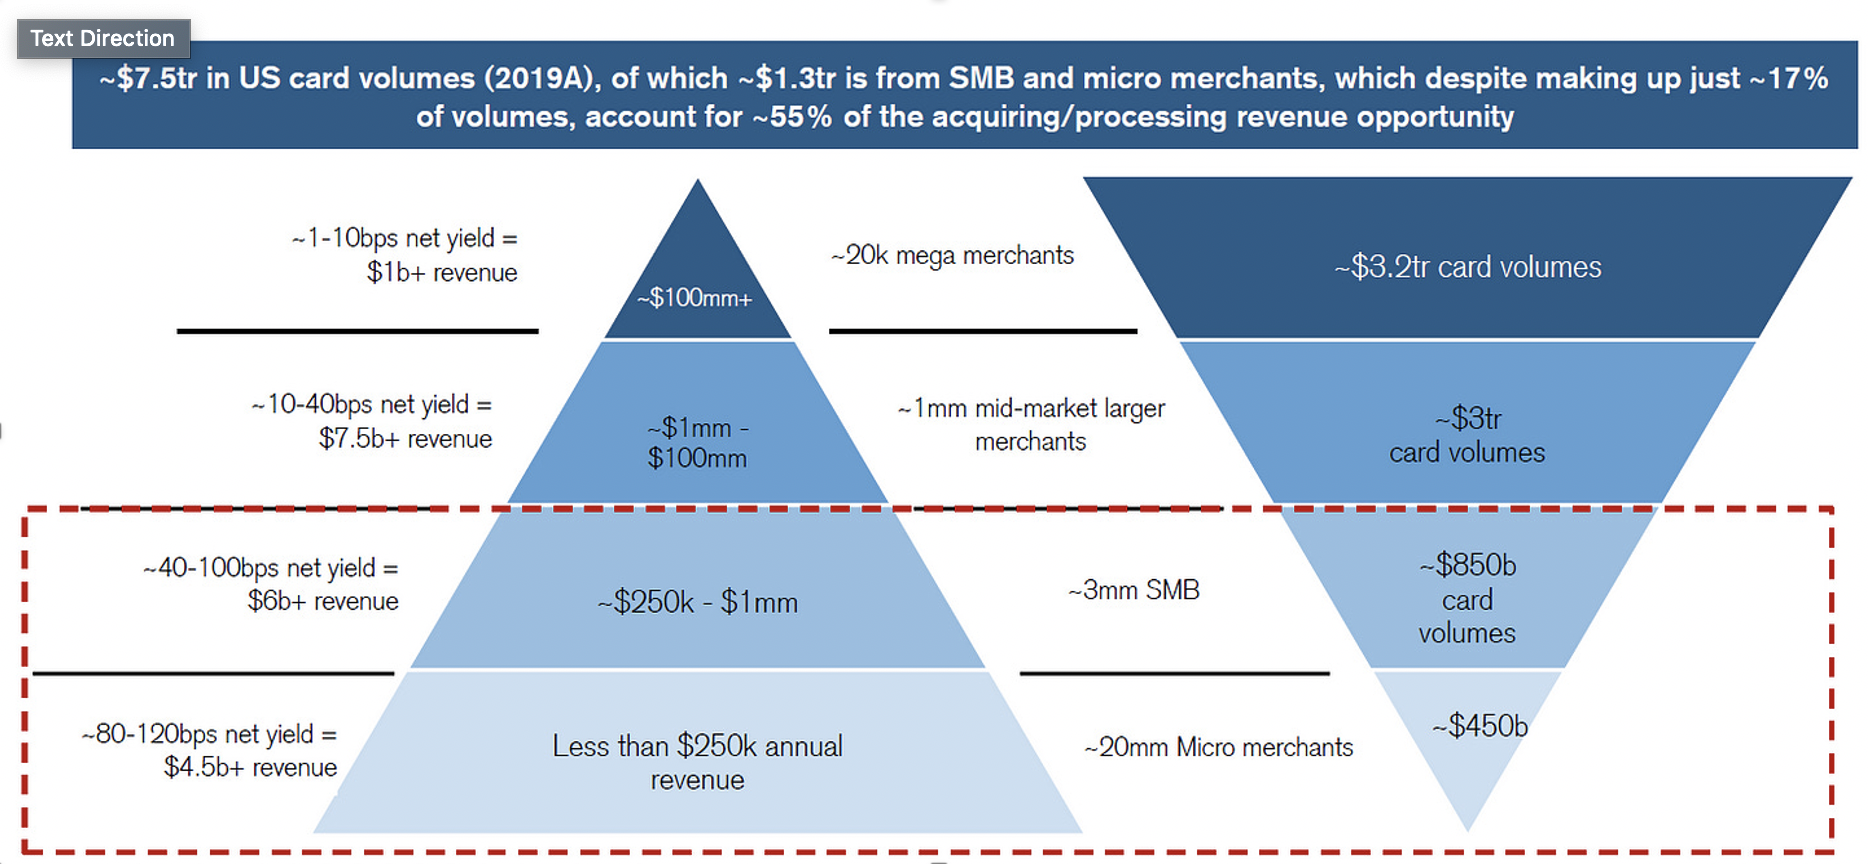
Figure 5 - Toast's Target Market 

Thesis 1.2: Superior growth model and superior product 

Currently, legacy POS systems like MICROS and NCR Aloha hold over 50% market share. Toast  differentiates itself with its Go-to-market Strategy. Legacy POS systems have a clunkier,  outdated product with no sophisticated OS or add-ons. In Tier 1 cities with more developed  sales forces, Toast has ~55-60% market share, indicating a high value proposition. Sales is a key  driving advantage in Toast go-to-market strategy. They had over 400 more sales reps than  Square and outspending competitors on sales and marketing. Toast's SG&A as a percentage of  revenue is ~16% vs 12% for Block. "And we were able to capitalize on [our product’s  advantages] by really extensively investing and building out our sales force to a point where  potentially at Toast, we had more sales reps than the entire industry combined," said a former  sales director at Toast. 

Toast has a growth-oriented sales model and Gillette-esque sales strategy. The negative  hardware gross margin is offset by high margin software sales and recurring transaction fees  given high switching costs. The negative margin still beats out competitors indicating operating  leverage advantages. The $700 ASP is consistent with competitors, but Toast has higher  hardware margins.  

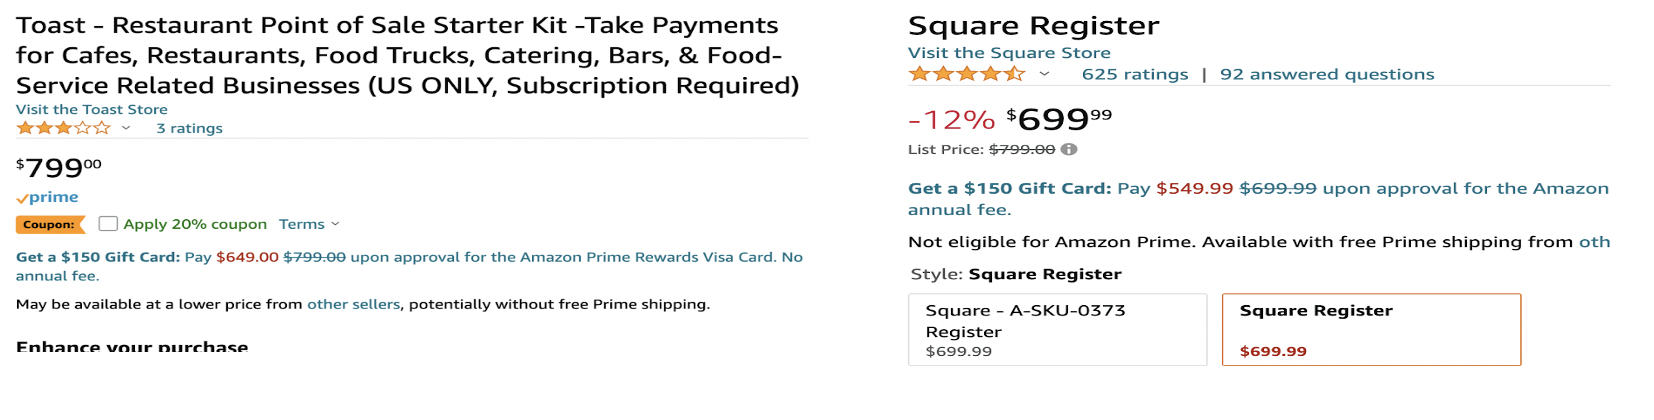
Figure 6 - Toast's advantages enable it to charge more for hardware

Toast’s lower CAC is owed to its better-targeted SMB offering. Unlike its competitors (Square,  Clover, Lightspeed) who focus on firms across verticals, Toast has focused on the restaurant  industry with specific features, such as inventory management, QR code payment, and delivery  services. Thanks to the tailored offering, Toast boasts of a~80% win rate vs peers. Competitors  confirm this. A VP of SpotOn, one of Toast’s competitors, said that "even if [our customers]  were happy, when Toast came in and made a compelling pitch … I would say we probably lost  75% of the time where they would go to Toast." The testimonial demonstrates Toast’s ability to  capture market share without competing strictly on pricing. 

Thesis 2.1: StratEx acquisition is highly accretive to ARR 

Toast’s acquisition of StratEx (now Toast’s Payroll module) in 2019 created significant ARPU  uplift opportunities as attach rates increase. 

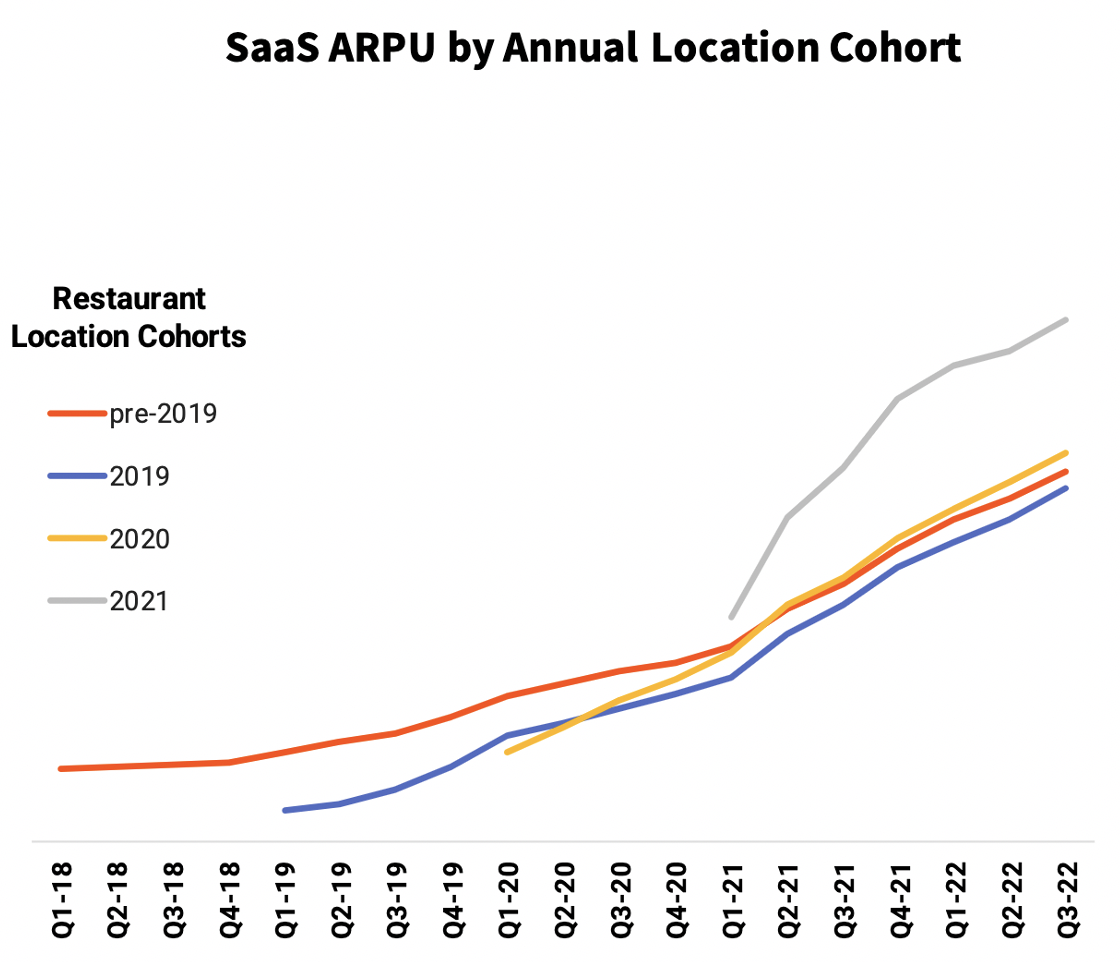
Figure 7 - Toast's ARPU has been increasing both within cohorts and on a cohort-by-cohort basis 

Overall, Toast's Q1 '22 earnings show high growth in their payroll attach rates, with 30% for  new bookings compared to 15% in Q1 '21. This indicates a high value product with fast  adoption growth. Additionally, net add-on sales for newly opened restaurants are around 30- 40%, indicating significant whitespace still available for growth. With these high growth figures,  Toast projects a significant impact on their annual recurring revenue (ARR) from the payroll module. In Q2 '22, they anticipate an attach rate of around 60% for at least 4 modules. 

Figure 8 - ARPU Growth is Driven by Increasing Attach Rates 

Given a current ARR of around $6,000, assuming all of this is non-payroll and growth at a  current 13% CAGR, and assuming payroll attach rate growth at 100% CAGR, the aggregate ARR  in n years will rise from 6k to 9k in about 3.5 years. The estimated pricing for Toast's product is  around $80/month, $12/employee, which can lead to $3,120 additional ARR/location per year  alone, given a 15 employee restaurant. 

Thesis 2.2: Toast has substantial room for take rates increases 

We are bullish on Toast’s increases in take rate. The continued adoption of virtual ordering  modules, such as Order & Pay and Toast Delivery Services, will drive up take rates for Toast.  Card-not-present (CNP) transactions increase take rates by around 0.5% per transaction,  compared to card-present (CP) transactions. Currently, only 20% of transactions are CNP, but  this is set to increase in the coming years due to attach rate increases to CNP modules. The  adoption rate for Order and Pay is around 10%, while Toast Delivery Service (which is an older  module) is now at around 75%. There is no reason not to see Order and Pay adoption rates  rising similarly, given the trends for QR code ordering and labor shortages. As CNP module  attach rates grow, take rates will move from around 0.5% to around 1%.

Figure 9 - Toast has already increased take rates

Take rates have already increased with virtually no analyst coverage. Starting December 1,  2022, Toast emailed customers and informed them that restaurants either had to: 

  1. accept a 0.15% increase per transaction, or 

  2. avoid the increase in the interchange rate if the restaurant accepts a $0.99 fee per  online transaction paid by the customers of the restaurant.  

The second option is even more attractive for Toast. The average online volume is around $32  dollars; the option would represent a 3% gross take rate on online orders. The change could  generate a 16 bps uplift down the line, resulting in a 6 bps higher take rate than the 0.5% take  rate that majority of sell-side analysts are flatlining. 

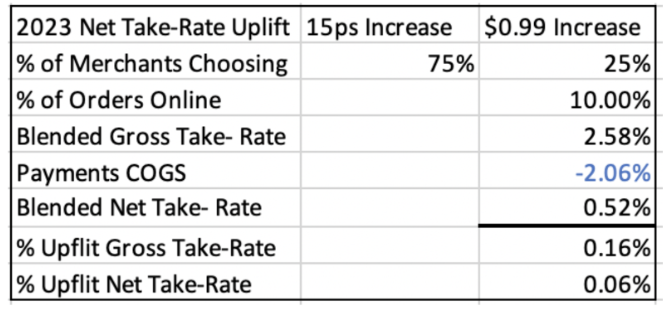
Figure 10 - Effect of recent take-rate increase in 2023 

Valuation 

Our valuation of Toast is driven by several key value drivers. Firstly, we anticipate strong growth  in the number of locations, with a projected CAGR of 21%. This is driven by an increase in  coverage of new add opportunities, a consistent win rate, and a growing share of restaurants  utilizing cloud-based point-of-sale systems. 

Another key driver is the growth of gross payment volume (GPV) and take rates. We anticipate  GPV per location to grow in line with inflation at a rate of 2% per annum. Additionally, we  expect to see a 16 basis points uplift in net take rates, coupled with an increasing share of card not-present (CNP) transactions, resulting in a projected CAGR of 1% for take rate growth. 

We also expect to see strong growth in services revenue, driven by an increase in payroll and  supplementary product attach rates, resulting in a projected CAGR of 13% for annual recurring  revenue per location. The Toast Capital and Restaurant Card offerings are also expected to  contribute to this growth, with projections of capturing 10% and 2% of loan volume and cost of  goods sold (COGS) respectively.

In terms of margins, we anticipate a 6 basis points uplift in net take rate and a higher share of  CNP transactions to drive margin expansion. Services margins are expected to remain steady,  while hardware and professional services will continue to be loss leaders with gross margins of - 40% and -350% respectively. Furthermore, we expect R&D and G&A expenses as a percentage  of sales to decrease with scale, similar to that of Square. 

Figure 11 - Valuation Assumptions

Using a weighted average of Vertical SaaS (12.5%), Restaurant PoS (75%), and Commerce  Facilitators (12.5%), we arrive at a 6x gross profit 2026 exit multiple for Toast.  

Overall, we believe that the company's strong growth potential and key value drivers make it a  compelling investment opportunity, with a base case IRR of 18.1% at a 5-year investment  horizon. 

Figure 12 - Valuation Outcomes

Risks & Mitigants 

1. Rise in Payment Processing Fees 

Increase in COGS take rates cutting directly into net take rates and gross profits 

Quantitative Impact: 

  • 25% gross profit CAGR with 2 bps. p. a. increase in COGS take rates vs 27% base case gross profit CAGR

  • Upside 85% compared to 102% in base case 

Qualitative mitigants: 

  • Toast scaling in volume should help it get greater rebates from card networks, bringing its take rates closer  to comps 

  • Toast recently diversified its card processors; now has two instead of one 

  • Toast was able to pass Visa & Mastercard’s ~0.10% increase in card network fees in April 2022 to its  customers, increasing net take rates in the process 

2. Recession 

  • Causing decline in GPV per location 

  • Negative new locations growth 

  • Willingness to spend on new modules crimped 

Quantitative Impact: 

  • 0% growth in services, GPV per location and -1% new locations in 2023-4 

  • 55% and 34% gross profit growth in 2023-4 vs. 60% and 37% growth in base case 

  • Upside 80% compared to 102% in base case 

Qualitative mitigants:

The restaurant industry has shown surprising resiliency in 2008-9 

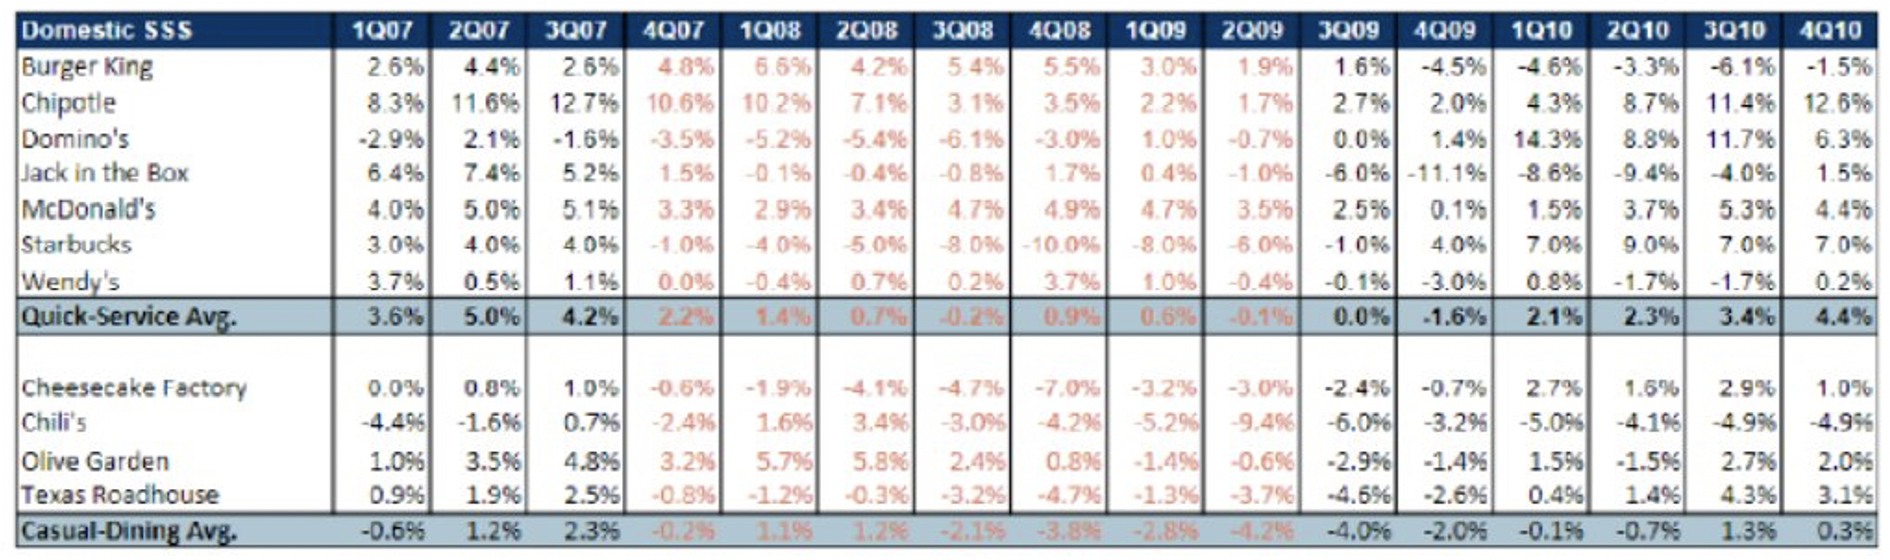
Figure 13 - Restaurant performance in 2008-9

3. Increased Competition 

  • Competitors under-cutting hardware costs and take rates 

  • Would force Toast to further lower hardware selling costs 

  • Might force Toast to offer lower take rates 

Quantitative Impact: 

  • -2.5 bps. gross take rate growth, -40% hardware margins and -400% professional services margins

  • 23% revenue CAGR and 31% gross profit CAGR and vs. 24% and 32% in base case

  • Upside 73% compared to 102% in base case 

Qualitative mitigants : 

  • Toast outcompetes in vectors other than fees 

  • Toasts’ customers are contract-locked for 1-3 years 

  • Competitors already offer $0 upfront hardware, not leaving room for undercutting 

  • Horizontal SaaS players won’t be willing to cut restaurants take rates 

  • Higher competitor net take rates are partially thanks to higher rebates, lowering gross take rates would cut  into competitors’ revenues and increase their COGS

Discord: Take Public Pitch*

* The content is for informational purposes only, you should not construe any such information or other material as legal, tax, investment, financial, or other advice.

By Gaby Tran, Carina Guo, Sivaanii Arunachalam

Business Overview 

Discord, founded in 2015, is a comprehensive communications platform built for communications. The platform allows gamers, and others, to organize themselves into “servers”. Discord’s main revenue streams are their premium subscriptions, fees from game sales and memberships, as well as server boosting. The company now boasts over 150 million active users, spread out amongst various servers, and 300 million registered accounts. The largest portion of Discord’s revenue is derived from the premium subscriptions. Called Nitro, the plan costs $9.99 per month or $99.99 per year. Customers also have the option to purchase an alternate version called Nitro Classic, available for $4.99 per month or $49.99 per year. The Company has experienced fast pace revenue and MAU growth in recent years. Discord generated $130 million revenue in 2020, an 188% increase year-on-year. In 2021, it was valued at $15 billion, doubling its value in under a year. 

Below is a graphical representation of Discord’s revenue growth in thousands.

Industry Overview 

Discord is uniquely situated at the intersection of gaming, social media, and others like blockchain, education, etc., allowing the company to penetrate numerous high growth industries. For example, the gaming industry has a $198.4B TAM and 8.9% CAGR, while the social networking apps industry has a $39.7B TAM and 23.6% CAGR. Generally, the online presence of industries across the board were spurred by COVID transition to digitization, turning consumers’ attention to versatile platforms like Discord’s. Amid this shift appeared an increased desire for more “novel” models of social interaction (for example, the “authenticity” element in BeReal). Discord, by allowing people to create entire miniature ecosystems in the form of servers with roles, access permissions, and additional customizable features, has captured the interest of millions of users during this time.

Below is a graph of how many thousands of users are in the most popular targeted servers.

Furthermore, Discord’s typical user demographic has a right skewed distribution for age (42% of users are 25-34) and consumers are predominantly (>90%) located in the United States. 

Some factors to keep an eye out for include resilience, scalability, and quality, which Discord maintains high standing for yet remain as important as ever. Additionally, while Discord currently does not monetize their user data, increased scrutiny over social media companies such as the TikTok/ByteDance controversy poses further necessary consideration if Discord were to shift its privacy strategy. 

Competitive Landscape 

Discord is frequently compared to companies in messaging, video call, work communication, and social gaming spaces such as Skype, Zoom, and Microsoft Teams. 

However, no company is actually that similar and none can act as a replacement for the wide scope of capabilities that Discord’s platform offers. While competitors tend to focus on video, text, or a specific industry, Discord’s advantage lies in its versatility and ability to latch onto the growing social network of people’s online presences. The most directly similar product to Discord is Slack, which offers a platform of a similar layout to Discord’s—with navigation sidebar, multiple channels per 

workspace/server, video and audio call, and a substantial user base. However, Slack’s advantages lay in a professional setting and its stronger features align with this, such as larger file sharing, privately saving posts, folders to organize sidebars. Essentially, Slack wishes to be a “digital HQ” whereas Discord is community-centric and thus is superior in audio/video quality. Discord offers a creative outlet for users

through its public forum, as well as private, server styles compared to Slack’s common use as a walled-off and organization-specific platform. While Slack remains entrenched in a professional lens, Discord’s background in gaming provided a comparatively more “informal” start that is more transferable to wider audiences, ensuring Discord’s continued growth. 

Thesis 1: Engaging, User-Friendly Product 

Discord has always emphasized its user-first philosophy, and this has resulted in unmatched user engagement. With a DAU/MAU ratio of a little over 50%, compared to Facebook at 60%, and its high long-term retention rate, Discord is well-positioned to monetize their consumer base. With this strong product, Discord has developed a platform that caters to a wider demographic. Its early years were filled with a focus on higher quality technologies for its gamer user base, drawing appeal from integrations with third-party streaming platforms. Then, COVID marked the onset of Discord’s era of adaptability and resilience, when the initial strong foundation of high-quality tech transformed the platform into a hub for community gathering and communication. At the present point in Discord’s timeline, network effects, diversified product offerings, and new monetization streams continue to propel the company’s growth. Discord has a growing and reliable audience—the proportion of people using Discord for non-gaming purposes went from 30% in late 2019 to 80% in late 2021, and the percentage of Americans under 54 using or interested in Discord went from 22% to 33% from COVID peak in January 2021 to August 22. 

Thesis 2: Upside Potential from Unbundling Nitro 

Nitro is Discord’s tiered recurring subscription model with an additional scalar quantity element in the form of “Boosts” (e.g., server improvements, larger file-sharing, etc.), whose benefits are primarily categorized into utility (e.g., higher streaming quality) and expression (e.g., custom stickers). Discord’s platform caters to a demographic that is used to paying for cosmetics, ranging from buying filters for Instagram to using skins in Fortnite and so on. Each new added feature accelerates the adoption curve, indicating underestimated upside potential as Discord adds additional features. 

Critically, Discord didn’t start focusing on revenue generation until mid-2021, before which the company only had 18 employees dedicated to this mission. Now, Discord is expected to reach 500M in revenue in 2022, the majority share of which comes from Nitro. Based on our revenue model, an estimated 3% of MAU users are paying for a subscription, compared to ~1-1.2% for the 3 years prior. This corresponds to paying user growth of 231% from 2020 to 2021. A further increase in conversion rate of free users due to the recently launched Nitro Basic plan (lower price, targets current non-paying users) can be expected. This is what makes entry into non-gaming sectors extra valuable. As a result, Discord does not rely upon monetizing per server, but rather discovers a revenue generation niche in its ability to monetize users. People often participate in multiple activities/have multiple interests that can develop well in a server-based model, so motivating users into a dedicated and loyal customer base has spurred Discord’s growth in the quantity of servers, which has attracted more users, and so on.

Thesis 3: Diversifying Monetization Avenues 

Discord is capitalizing on a valuable creator monetization opportunity, where erver owners can offer custom subscription tiers (ranging from $1.99 to $199/month) to give users access to premium content, with Discord taking a 10% cut. There is already an underground economy on Discord that external channels (YouTube, Patreon, Twitch, Shopify) are already monetizing, and Discord now has an opportunity to take it native. However, the relationship is not necessarily competitive; creators can get people to subscribe on both channels for different benefits. The key value-add for Discord is synchronous conversations because while other platforms focus on consumption, Discord’s success is largely attributed to its high-quality engagement. 

Risks and Mitigants 

  1. Risk: Discord often experiences relatively high user churn. 

    1. Discord has increased its focus on improving the onboarding experience, especially in large, public servers, in order to mitigate this risk. For example, features include a home tab to catch up on what you missed or smart notifications to increase ease of use. 

    2. Discord counters this with its high long-term retention—once people stay over 6 months, they’re basically part of the consumer base forever. Discord has numerous opportunities for growth by further drawing in existing loyal customers’ attention into a wider scope of servers, therefore using the network effect to bring new users on.

  2. Risk: Discord experienced stalled growth post-COVID. 

    1. This is largely a directly post-COVID phenomenon resulting from the surge in in-person activities following years of lockdown. After this surge inevitably tapers off, people will continue to use online platforms for communication. In fact, the end of the pandemic facilitates increased group formation from growing social activity, and Discord has already established itself as the worthy option for this. 

    2. COVID-19 laid the foundation for healthy, active communities to thrive on Discord. The pandemic pulled growth forward several years in just one year, allowing them to break into non-gaming sectors. 

  3. Risk: Discord may not be able to execute a successful IPO. 

    1. This is highly dependent on market conditions, and there has generally been very low IPO activity now with tech being hit extra hard. However, there is likely no shortage of companies willing to acquire Discord. The company’s growth is undeniable and its attractiveness towards companies like Microsoft (which attempted to acquire Discord) is proof of that. 

    2. Discord has a strong leadership team with backgrounds in both IPOs and M&A. For example, Discord hired Tomasz Marcinkowski, who had led Pinterest’s successful IPO in 2019, as its first CFO. 

Valuation

In their last round of funding in 2021, Discord achieved a post-money valuation of $15 billion. Discord hopes to go public by the end of 2024 with an ambitious revenue target of $1 billion, which implies a 40% annual revenue growth rate from their estimated 2022 revenue of $500 million. Slack was purchased by Salesforce in 2021 for $27.7 billion, which corresponds to a 42x EV/Revenue multiple. Prior to the acquisition, Slack was trading at ~30x EV/Revenue. This gives Discord an implied valuation of $15 to 20 billion.

Thryv (NASDAQ: THRY) Long Recommendation at $18.95 PT*

* The content is for informational purposes only, you should not construe any such information or other material as legal, tax, investment, financial, or other advice.

As of 22 Jan 2023 – Current Price: $18.95 | Target Price: $32.78 | Implied Upside: 72.9%

By Eshaan Doke, Vishakh Arora, Oliver Zhang


Description: 

In light of the pandemic, companies face a market that increasingly uses remote purchases, and have had to digitize traditional methods. A company currently undergoing this transformation is Thryv (NASDAQ: THRY). 

Thryv is a legacy SMB marketing services incumbent transitioning to a SaaS CRM model. Thryv’s SaaS business includes Thryv’s CRM software for invoice and quote management, marketing automation, project management, omnichannel customer communication, appointment scheduling, payment processing, and online presence management. It has 3 main products: Hub by Thryv, which manages day-to-day operations and franchises by linking reporting locations into one UI; Thryv Leads, which is a ML for ad placement and acquiring new customers, which improves lead quality and quantity; and ThryvPay, which processes credit card and ACH payments for SMBs to facilitate rapid transactions. 

They are priced the lowest among competitors, and are superior at acquiring, cross-selling, and upselling customers. This is because they are using cash flows from legacy marketing services to fund the transition, and tapping into their sticky customer base to sell the new product. This product works, as clients report 86% revenue increase and 61% appointment booking increase. 

However, this transition is underappreciated due to its nascency. Thryv is misclassified as “Marketing and Advertising” in GICS alongside defunct legacy providers, and trades at a 1x multiple as opposed to the SaaS CRM industry average of 8x. As SaaS revenue share grows (currently 15%), this mispricing will be corrected. 


Industry Overview: 

Thryv operates within the SaaS CRM industry, which consists of social media monitoring, customer service/experience management, as well as analytics and marketing/salesforce automation. This market is expected to grow at a 12% CAGR to 2030, reaching $58.5B in 2030. Thryv specifically targets the SMB space, and per an industry survey of SMBs, 77% of SMBs need an SMB platform with all the tools in one place, and 64% want to buy these only from one provider. Thryv estimates its SMB target market is 4M out of 31M SMBs in the US & 8M out of 70M SMBs globally. 

Within this industry are several tailwinds. First, there is a growing digitization initiative as more focus on digitizing marketing efforts leads to greater extracting of customer insights from large data sets using ML. Second, increased churn and attrition forces SMBs to focus on retaining customers and onboarding, which necessitates stronger SMB-centric SaaS CRM solutions. 

Headwinds in the industry include the macro environment. The recession brings about corporate thrift. Short-term decreases in marketing spend are probable amidst a recessionary environment and slowing onboarding of new customers to CRM, though subscriptions are minimally impacted. Second, the rise of vertical specific SaaS with embedded CRM and payment solutions increases competition for industry agnostic SaaS CRM like that Thryv provides. 


Investment Thesis: 

  1. The market values Thryv as a legacy print marketing services provider and not a SaaS CRM company, in part due to misclassification and zero analyst coverage. Thryv’s SaaS segment is still ramping up and is projected to grow at a 22.1% CAGR to 2030 after experiencing 22.4% growth in FY2021. Projections suggest the SaaS segment will overtake the marketing segment in mid 2025. Thryv’s SaaS segment’s growth is being underappreciated due to the nascency of the transition and zero bulge bracket analyst coverage. Moreover, Thryv is misclassified as “Marketing and Advertising” in GICS alongside defunct legacy providers instead of with SaaS CRM providers in ”Software Automation.” As SaaS revenue share grows by 2025 (currently at 15%), this mispricing will likely be corrected with the market gaining confidence too late. 

  2. Legacy marketing services customers serve as a large base of SMBs to cross-sell and upsell to for at least the next 5-7 years. 400,000 legacy marketing services customers form base to be cross-sold. Their M&A strategy boosts cross-sell opportunities while increasing technological prowess. Also, the Sensis acquisition at ~4.5x EBITDA brings 100,000 Australian customers to cross-sell. Even assuming a 9% penetration rate, Thryv can sell SaaS offerings to 9,000 Sensis customers. With a 2022E ARPU of $410 that is $43.2M in revenue. Recent opening of regional HQ in Toronto and partnership with Canadian Franchise Association brings access to 1.5m new SMBs. Currently, roughly 20,000 (~5%) of legacy marketing customers have been cross-sold to SaaS, meaning another 5-7 years of efficient cross-selling will occur. Diverse and more relevant SaaS offering provide more room to upsell THRY’s strategy is to first sell Hub by Thryv and then upsell customers other automation tools such as ThryvPay and marketing center tools like Thryv Leads ARPU increase of 16.9% (2020) and 29.3% (2021) demonstrate upsell ability Thryv’s continuous addition of new modules in their SaaS suite mean more upsell opportunity, with three new modules set to be released from 2023 to 2025. 

  3. Thryv’s superior product tailored to SMBs is priced at the lowest end of the range, and converting legacy customers minimizes customer acquisition costs. Thryv provides the widest range of offerings, which makes it best tailored to SMBs. G2 rates Thryv significantly above average in all categories, including Overall Product, Quality of Support, Ease of Use, and Ease of Setup (Thryv: 9.2, 9.3, 8.9, 8.8; CRM Average: 8.0, 8.6, 8.6, 8.5). While CRM products are not significantly differentiated technologically, Thryv maintains an edge by bundling directory submissions with other offerings, which appeals most to SMBs. Also, Thryv is priced at the lower end of the range. Note that Salesforce and Keap are priced per user per month, distorting the true figure as Thryv’s offerings can be used by up to 10 users. Thryv’s net dollar retention of 92% is comparable to that of competitors (Salesforce: 91%, Hubspot: 110%). Thryv’s LTV/CAC is 3.2, compared to Hubspot’s 2.1 and Salesforce’s 1.9. This is in part because Thryv saves ~25% in marketing costs when converting legacy customers. This sales efficiency translates into higher margins for Thryv. Finally, Thryv’s EBITDA margin of 28% is higher than Salesforce’s (12%) and Hubspot’s (2.5%) and will increase with scalable SaaS revenue. 

Valuation/Assumptions: 

  • WACC of 12.8% 

  • Marketing Services Customers and ARPU decline by 10% and 3.8% in 2022 and at slightly slower decaying rates afterward. 

  • SaaS Customer growth at 5% for 2022 and peaking at 9% around 2026 to account for macro and increased onboarding; SaaS ARPU increasing to reflect upsell and introduction of new modules.

  • Conservatively flatlined Thryv International Revenue and COGS (37%), since SaaS transition lowers COGS and boosts margins. 

  • Implied share price of $32.78, which reflects a 72.9% upside to the current price of $18.95.


Catalysts: 

  • In October 2022, Thryv announced the launch of their Marketing Center, presenting a new opportunity to upsell/cross-sell customers. 

  • Management plans to acquire marketing services companies to expand their domestic client base and enter new markets internationally in the following years. 

  • In October 2022, Thryv announced Canadian headquarters and began offering ThryvPay to Canadian SMBs, a market with 1.5 million businesses. They expect revenue growth from this to play out in 2023. 


Risks and Mitigants: 

  • Creating Thryv’s ecosystem does not improve churn 

  • SMB SaaS becomes increasingly commoditized with plug-in solutions